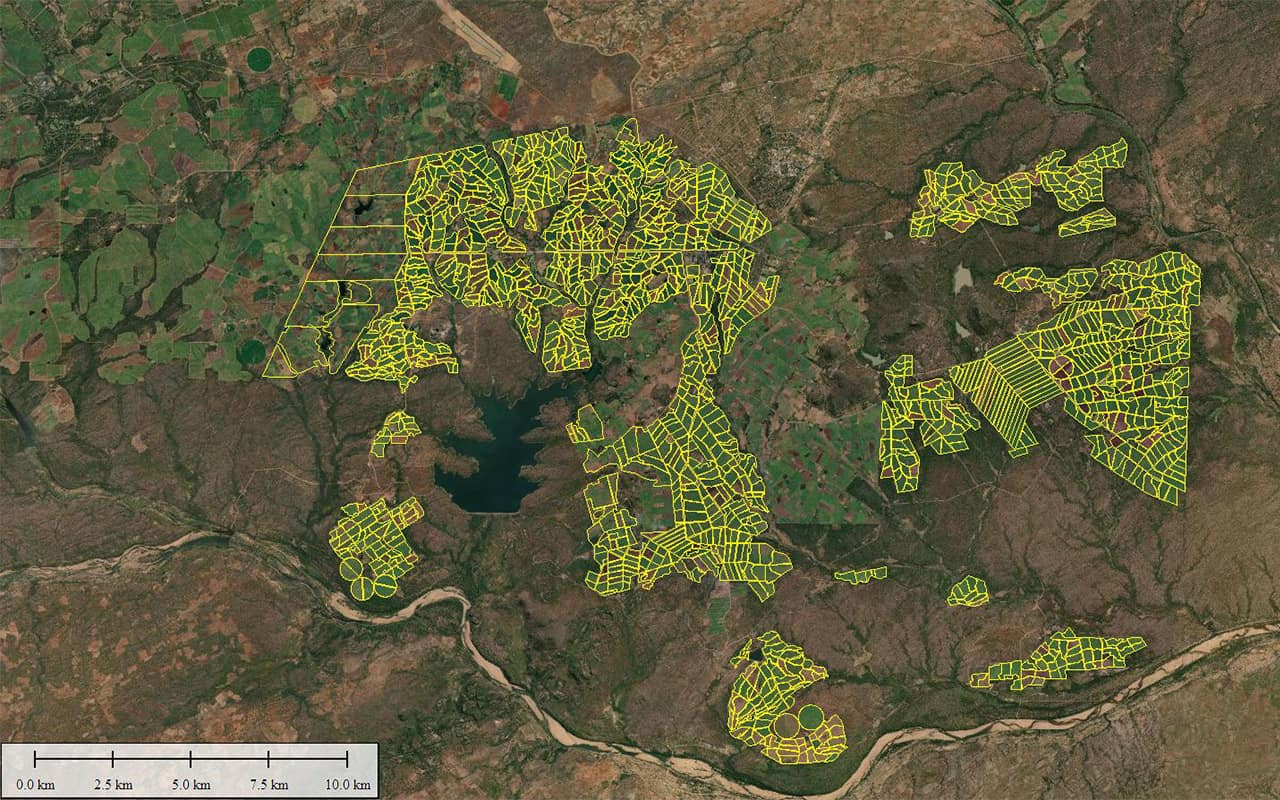
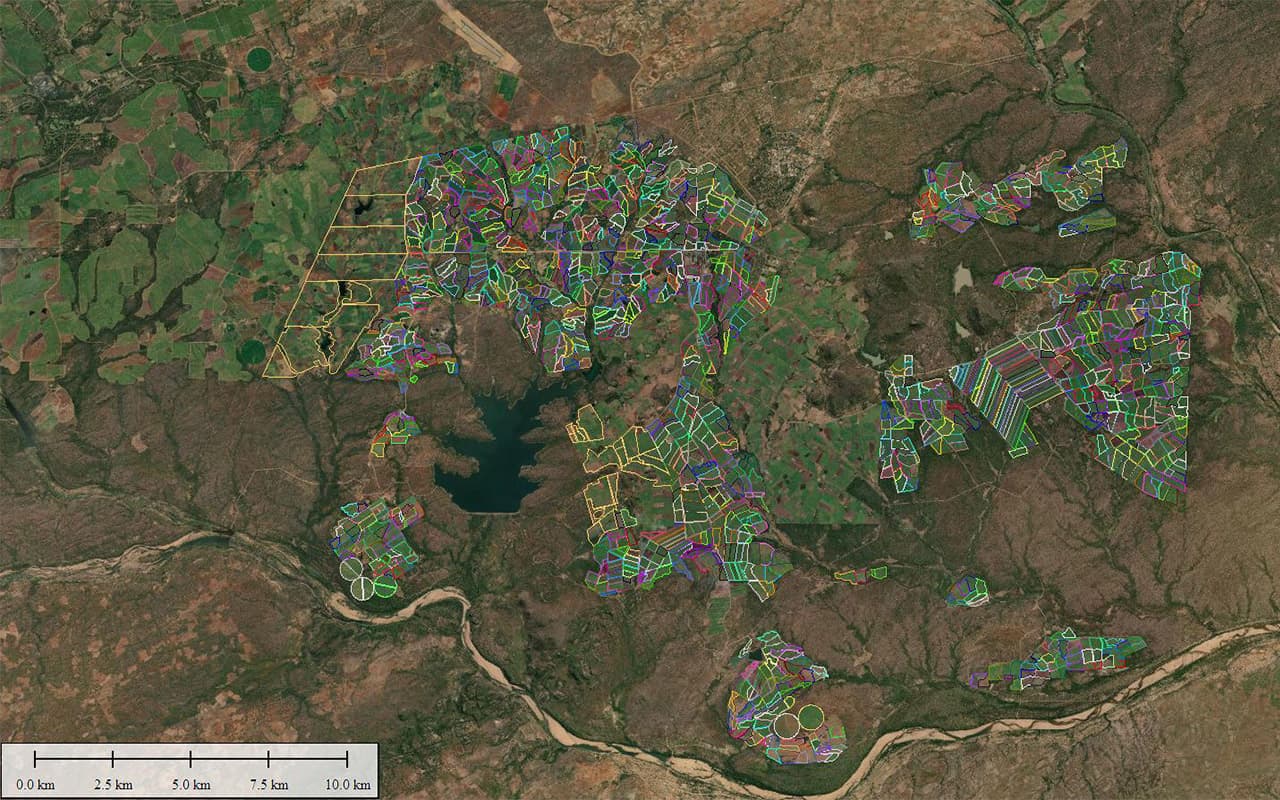
SUGAR CROP AREA AUDIT
ZIMBABWE, SOUTH AFRICA AND MOZAMBIQUE
Satellite sensors provide coarse image data with additional image bands beyond just RGB. Satellite data can be acquired at fairly regular intervals, depending on cloud cover, making comparative analysis possible. Modern satellite services are offering data at continually higher resolutions and lower costs as the technology evolves.
WGS has been able to utilise freely available Sentinel II imagery to analyse change over time and provide confirmation of harvest data. Using existing field polygons as a vector layer, an average crop health indicator value for all raster cells within each vector polygon was determined. This value is automatically calculated each week if cloud free satellite data is available and compared to the previous value. This allows WGS to analyse hundreds of square kilometres of cropland completely autonomously and identify when a field has been harvested within a week of harvest.
LOCATION:
-25.10491S, 30.33756E
Location
Location
Zimbabwe
Location
| EXTENT: | 100,000 km² |
| DATE | 2018 |
| IMAGERY: | 50cm RGB 5m multispectral |
| LIDAR: | None |
| EQUIPMENT: | Satellite Imagery |


